BitcoinPulse: Bitcoin Market Analysis - April 1, 2025

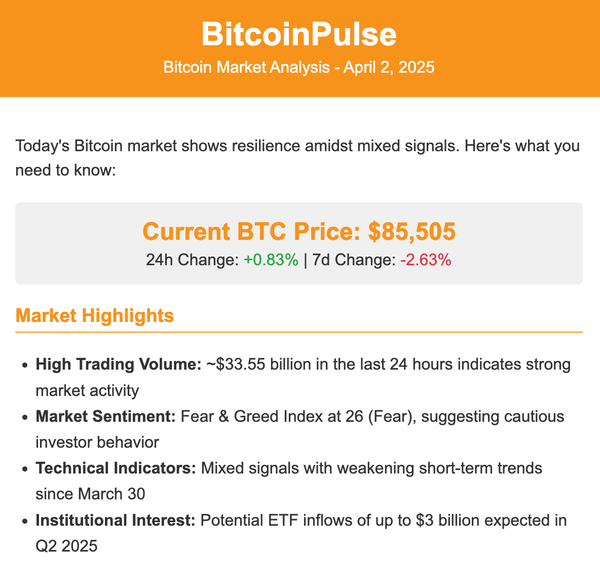
Bitcoin currently trades at $84,942.58 with a market cap of $1.73 trillion. After hitting an all-time high of $109,464.94 in January, BTC has corrected but now shows signs of recovery within an ascending parallel channel. Our base case predicts Bitcoin reaching $87,000-$93,000 by the end of April (60% probability), with potential for $98,000-$100,000 in bullish conditions (25% probability).
Current Market Snapshot
- Price: $84,942.58 (+1.47% in 24hrs)
- Market Cap: $1.73 trillion
- Trading Volume: $25.31 billion (-31.63%)
- Total Crypto Market: $2.77 trillion (-1.27%)
- Fear & Greed Index: 27 (Fear)
Key Influencing Factors
Macroeconomic Environment
- U.S. Trade Policy: New tariffs targeting Canada, Mexico, and China take effect April 2, creating market uncertainty and potential inflationary pressure
- Federal Reserve Stance: Recent dovish signals from Chair Powell suggest possible monetary easing to counter inflation, potentially benefiting Bitcoin as an inflation hedge
Institutional Developments
- ETF Activity: Continued strong inflows into spot Bitcoin ETFs, with nearly 80% coming from retail investors
- Institutional Adoption: Growing wirehouses interest; ETFs projected to hold 7% of Bitcoin's circulating supply by year-end
Supply Dynamics
- Post-Halving Effects: The April 2024 halving (reducing block rewards to 3.125 BTC) continues to tighten supply, historically a bullish catalyst for medium-term price appreciation
Technical Analysis
Key Price Levels
- Current Position: Consolidating at $84,942.58
- Critical Support: $77,114 (must hold to maintain bullish structure)
- Immediate Resistance: $89,434 (breakout target)
- Secondary Resistance: $93,478
- Downside Risk Level: $74,000
Technical Indicators
- Moving Averages: Price finding support at 200-day SMA ($84,704) with resistance at 50-day SMA ($89,357)
- RSI: Currently at 51.48 with upward momentum, indicating growing strength without overheating
- Chart Pattern: Establishing an ascending parallel channel since mid-March recovery
- Volume Profile: Declining volume suggests consolidation phase before next directional move
Advanced Pattern Analysis
- EMA Ribbon: Currently providing resistance that needs to be broken for confirmation of bullish momentum
- Market Structure: Higher lows forming since March bottom, but needs to break above March high ($96,484) to confirm reversal
- Volatility Contraction: After six-month high volatility in March, narrowing Bollinger Bands suggest impending volatility expansion
April 2025 Price Prediction
Base Case (60% Probability): $87,000-$93,000
- Catalyst: Gradual continuation of ascending channel pattern
- Supporting Factors: Steady ETF inflows, stabilizing macroeconomic conditions after initial tariff volatility
- Key Event: Mid-month break above $89,434 resistance leading to $93,000 test
- Limiting Factor: Profit-taking below psychological $95,000 level
Bull Case (25% Probability): $98,000-$100,000
- Catalyst: Accelerated U.S. monetary easing
- Supporting Factors: Milder-than-expected tariff impact, surge in institutional buying
- Key Event: Fear & Greed Index recovery above 50
- Target: Retest of $100,000 psychological resistance
Bear Case (15% Probability): $74,000-$77,000
- Catalyst: Tariff-induced broad market risk-off event
- Supporting Factors: Heightened regulatory concerns, breakdown of technical support
- Key Event: Failure of $77,114 support level
- Risk: Cascade of liquidations in overleveraged positions
Trading Strategy
- Long-Term Holders: Maintain positions with potential to add on dips to $77,000-$80,000 range
- Short-Term Traders: Watch for breakout above $89,434 for long entries with tight stops
- Risk Management: Size positions conservatively given tariff uncertainty and recent volatility
- Key Dates: April 2 (tariff implementation), upcoming Fed statements
Conclusion
Bitcoin shows cautious optimism despite macroeconomic headwinds. The technical structure remains bullish as long as $77,114 support holds. Traders should closely monitor U.S. economic policy developments while keeping an eye on key resistance at $89,434, which will likely determine April's directional bias. The post-halving environment and institutional adoption via ETFs provide structural support for continued bullish momentum throughout Q2 2025.
