Bitcoin Cycle Analysis: Why Now May Be a Critical Accumulation Period
In the turbulent sea of cryptocurrency markets, accurately understanding Bitcoin's cyclical nature might be the key to investment success. With almost 11 months passed since the April 2024 halving event, data indicates we may be in the golden window for strategic accumulation.
The Revelations of Bitcoin's Historical Cycles
Bitcoin's price movements demonstrate a highly cyclical pattern that correlates strongly with its quadrennial halving events. This cyclicality not only provides investors with a predictable framework but also creates strategic entry opportunity windows.
Review of Previous Cycles
| Halving Cycle | Halving Date | Pre-Halving Price | Peak Date | Peak Price | Time to Peak | Peak Increase |
|---|---|---|---|---|---|---|
| First Halving | 2012-11-28 | ~$13 | 2013-12 | $1,242 | 13 months | >9,000% |
| Second Halving | 2016-07-09 | ~$650 | 2017-12 | $19,783 | 17 months | ~3,200% |
| Third Halving | 2020-05-11 | ~$8,500 | 2021-11 | $69,000 | 18 months | ~762% |
| Fourth Halving | 2024-04-19 | ~$70,000 | Expected 2025-04 to 10 | Expected $200,000-$300,000 | Expected 12-18 months | Expected 185-329% |
Note: Fourth cycle data based on historical pattern projections
Key Insights
Each cycle exhibits unique characteristics, but common threads include peak prices occurring 12-18 months post-halving and each new peak substantially exceeding the previous cycle peak:
- First Cycle: Exhibited a "double-peak" formation, highly speculative with immature infrastructure
- Second Cycle: Single peak formation, accompanied by ICO boom, unprecedented media attention
- Third Cycle: Relatively mature market, increased institutional participation, more moderate growth
Current Market Position Analysis
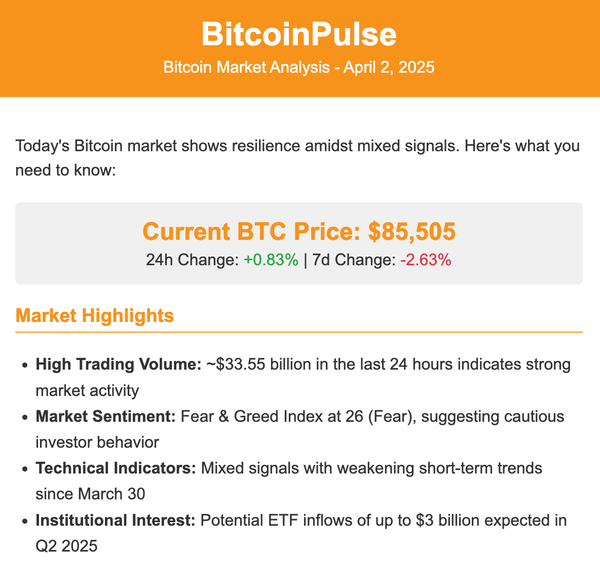
As of March 17, 2025, Bitcoin trades at approximately $85,000, representing a 21% increase from its $70,000 price at the April 2024 halving. This growth is relatively moderate, suggesting early-cycle positioning compared to historical cycles.
Data Supporting the Current Accumulation Thesis
- Cycle Positioning: Currently in month 11 post-halving, with historical peaks occurring 12-18 months post-halving
- MVRV Z-Score: Current values indicate the market is not overheated and has not reached historical bull market peaks
- On-Chain Activity: Increasing number of active addresses indicating growing adoption
- Institutional Participation: Sustained inflows post-ETF approval creating new demand dynamics
- Macro Environment: Global rate-cutting cycle potentially providing support for risk assets
Strategic Entry Index™ Indicators
Our proprietary Strategic Entry Index™ combines multidimensional data and currently indicates we are in the "Accumulation Zone." This index incorporates:
- Halving cycle timeline positioning
- Price ratios relative to historical peaks and projected future peaks
- Composite signals from key on-chain metrics
- Technical analysis parameters (e.g., relative strength index and moving averages)
- Market sentiment indicators
Current Index Reading: 1.0, strongly suggesting this is an optimal time for strategic accumulation.
Why Now Is a Critical Accumulation Period
The current market offers a unique accumulation opportunity for several compelling reasons:
- Cycle Positioning: We have not yet entered the parabolic rise phase typically seen at cycle ends
- Risk-Reward Ratio: Current price offers significant upside potential to projected cycle peaks
- Institutional Adoption: Post-ETF sustained demand creates stable price support
- Global Macro Backdrop: Rate-cutting cycle likely to provide tailwinds for risk assets
- On-Chain Health: Core network metrics show continued adoption and increased long-term holding
Accumulation Strategy Recommendations
In the current market environment, consider the following accumulation strategies:
- Dollar-Cost Averaging: Set up automatic periodic purchases to smooth entry price
- Layered Entry: Divide capital into 3-5 portions for entry at different price points
- Volatility Utilization: Use short-term pullbacks to improve average entry position
- Long-Term Perspective: Set minimum 12-24 month holding period to span the full cycle
- Risk Management: Only invest capital you can afford to lose entirely
Market Structure Comparison: 2021 vs. 2025
The current cycle demonstrates notable differences from the previous one:
| Aspect | 2021 Cycle | 2025 Cycle |
|---|---|---|
| Institutional Adoption | Early stage, limited ETF options | Mature, multiple spot ETFs with significant AUM |
| Regulatory Clarity | Uncertain, evolving | Improved framework in major markets |
| Market Infrastructure | Developing | Robust, institutional-grade |
| Derivatives Market | Retail-dominated | Institutional participation, regulated futures |
| Public Awareness | Mainstream attention | Normalized asset class perception |
| Leverage Levels | Extremely high | More moderate and distributed |
This structural evolution suggests a potentially more sustainable and less volatile uptrend compared to previous cycles.
Long-Term Fundamentals Supporting Current Accumulation
- Continued Adoption Curve: S-curve adoption metrics indicate we remain in early mainstream adoption phase
- Supply Dynamics: Recent halving reduced new supply by 50%, with over 93% of all Bitcoin already mined
- Institutional Integration: Traditional finance increasingly incorporating Bitcoin as an alternative asset class
- Technical Network Growth: Lightning Network capacity up 215% since 2022, improving scaling capabilities
- Macro Economic Positioning: Growing perception as an inflation hedge and portfolio diversification tool
The Mathematical Case: Expected Value Calculation
Based on historical cycle data and current market positioning, we can derive a probabilistic expected value calculation:
| Scenario | Probability | Price Target | Weight |
|---|---|---|---|
| Bull Case | 35% | $300,000 | $105,000 |
| Base Case | 45% | $200,000 | $90,000 |
| Bear Case | 20% | $60,000 | $12,000 |
| Expected Value | $207,000 |
With current prices around $85,000, this suggests a positive expected value of approximately 144%, supporting the accumulation thesis.
Conclusion
Historical cycle analysis, current market positioning, and the Strategic Entry Index™ all point to one conclusion: now may be a critical period for Bitcoin accumulation. While prices have exceeded the previous cycle peak, historical patterns and market indicators suggest we're likely still in the early stages of this bull market.
This represents a rare opportunity window for investors to establish positions at relatively "reasonable" prices in preparation for the potential upside cycle ahead.
Want to access the complete Strategic Entry Index™ signals and professional trading recommendations? Visit bitcoinpul.se to subscribe to our premium analysis service and unlock deeper market insights and real-time trading signals.


